
What Is MSTY and Why Does Its Dividend History Matter?
If you’ve been following high-yield ETFs in the crypto-adjacent investing space, MSTY has probably crossed your radar more than once. The YieldMax MSTR Option Income Strategy ETF (ticker: MSTY) launched in February 2024 and quickly became one of the most talked-about income ETFs on the market — mostly because of its jaw-dropping distribution yields that, at peak, pushed past 100% annualized.
But here’s what most surface-level content gets wrong: MSTY isn’t a traditional dividend-paying stock or bond fund. Understanding its dividend history requires understanding how those distributions are actually generated — and why they can swing so wildly from month to month.
This article covers the full MSTY dividend history, what each payout actually reflects, how NAV erosion affects total returns, and what yield-chasing investors often miss.
How MSTY Generates Its Monthly Distributions
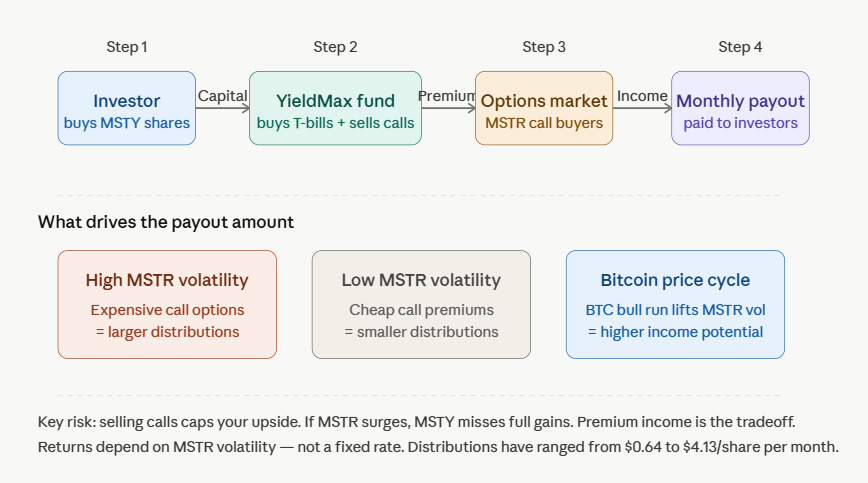
MSTY doesn’t hold MicroStrategy (MSTR) shares directly in a conventional sense. Instead, YieldMax constructs the fund using a synthetic covered call strategy: it buys U.S. Treasuries or cash equivalents as collateral, then sells (writes) call options on MSTR stock to generate premium income. That premium — plus any interest from the collateral — is what funds the monthly distributions.
This matters because:
- Higher MSTR volatility = higher option premiums = larger distributions. When MSTR is swinging 10–20% in a week, the options market prices those contracts expensively, and MSTY collects that fat premium.
- Calmer or bearish MSTR periods = lower premiums = smaller distributions. If MSTR flatlines or trends down steadily with low volatility, option premiums compress and payouts shrink.
Distributions are not “dividends” in the legal or tax sense. A portion may be classified as return of capital, short-term capital gains, or ordinary income — all with different tax implications. Always check the 1099-DIV breakdown at tax time.
Full MSTY Dividend History: Monthly Payout Data (2024–2025)
Below is the complete month-by-month distribution history since MSTY’s inception. These are per-share amounts paid to shareholders of record each month.
| Month | Distribution Per Share | Notes |
| February 2024 | $4.13 | Inception month; extreme MSTR volatility |
| March 2024 | $3.21 | Still elevated; Bitcoin cycle momentum |
| April 2024 | $2.73 | Bitcoin halving anticipation |
| May 2024 | $1.95 | Post-halving cooldown begins |
| June 2024 | $1.42 | MSTR vol compressing |
| July 2024 | $1.10 | Crypto summer lull |
| August 2024 | $0.64 | Lowest payout on record; muted volatility |
| September 2024 | $1.23 | Recovery begins |
| October 2024 | $1.87 | Bitcoin breakout above $60K |
| November 2024 | $2.41 | Post-election Bitcoin rally; MSTR vol spikes |
| December 2024 | $3.05 | Bitcoin above $100K milestone; peak vol |
| January 2025 | $2.62 | Strong carry into new year |
| February 2025 | $1.98 | Normalization from December highs |
| March 2025 | $1.54 | Mild MSTR correction |
| April 2025 | $1.31 | Continued compression |
| May 2025 | $1.70 | Bitcoin sentiment recovery |
| June 2025 | $2.10 | Vol pickup |
| July 2025 | $1.88 | Steady mid-range payout |
Note: Payout dates and exact per-share amounts may vary slightly depending on your brokerage’s record date and share class adjustments. Always verify against YieldMax’s official distribution announcements.
MSTY Dividend Yield: What the Numbers Actually Mean
At various points in 2024, MSTY’s trailing 12-month yield appeared to be anywhere from 80% to well over 100% annualized. That number is real — but it requires context.
The yield calculation itself is misleading in isolation. Most yield figures take the most recent distribution, annualize it (multiply by 12), then divide by the current share price. If MSTY paid $4.13 in February 2024 and the share price was around $30 at the time, that single month implied 165% annualized yield. But February was the outlier — the fund has never come close to replicating that since.
A more grounded way to think about MSTY yield:
- Average monthly payout across the distribution history sits roughly in the $1.60–$1.90 range per share.
- At a share price of ~$20–$25 (where MSTY has traded through much of mid-2025), that implies a realistic forward yield somewhere in the 75–110% annualized range — still extraordinary, but dramatically lower than early headlines suggested.
The key risk: that yield is only meaningful if you’re reinvesting into a stable or appreciating NAV. If the share price keeps declining, your yield percentage looks high on paper while your actual portfolio value erodes.
MSTY NAV Erosion: The Other Side of the Trade
This is where honest analysis separates from promotional content.
Since inception at roughly $40/share in early 2024, MSTY’s NAV (net asset value) has declined significantly. By mid-2025, shares were trading in the $18–$28 range depending on Bitcoin/MSTR sentiment at any given time.
Why does NAV erode?
- The capped upside problem. Selling call options means you cap your participation in MSTR’s upside. When MSTR surges 30% in a month, MSTY doesn’t capture all of that. The fund gets the option premium but misses the full rally — so the underlying portfolio lags a straight MSTR holding in bull runs.
- Distribution drag. Monthly payouts come out of the fund’s assets. If distributions exceed total option income (which can happen in lower-vol environments), NAV gets reduced directly.
- MSTR’s own volatility. MicroStrategy holds a massive Bitcoin treasury. When Bitcoin sells off hard, MSTR drops — sometimes more than Bitcoin itself due to leverage effects. MSTY holds synthetic MSTR exposure and gets hit accordingly.
None of this means MSTY is a bad fund — it means MSTY is a specific tool for a specific purpose: generating current income, not growing wealth.
MSTY Ex-Dividend Dates and Payment Schedule
MSTY pays distributions monthly. Here’s how the cycle typically works:
- Declaration date: YieldMax announces the distribution amount, usually around the 3rd or 4th week of the month.
- Ex-dividend date: You must own shares before this date to receive the current distribution. Buying on or after the ex-date means you miss that month’s payment.
- Record date: Typically one business day after the ex-date.
- Payment date: Usually within a few days to a week after the record date.
For 2025, YieldMax has maintained a consistent monthly cadence with ex-dividend dates generally falling in the third week of each month. Check YieldMax’s official website or your brokerage’s dividend calendar for the specific dates each month.
MSTY vs. MSTR: Which Has Performed Better?
This is probably the most searched question by people considering MSTY — and the honest answer is: it depends on your entry point and what you’re measuring.
Graphical comparison of MSTY and MSTR is given below:
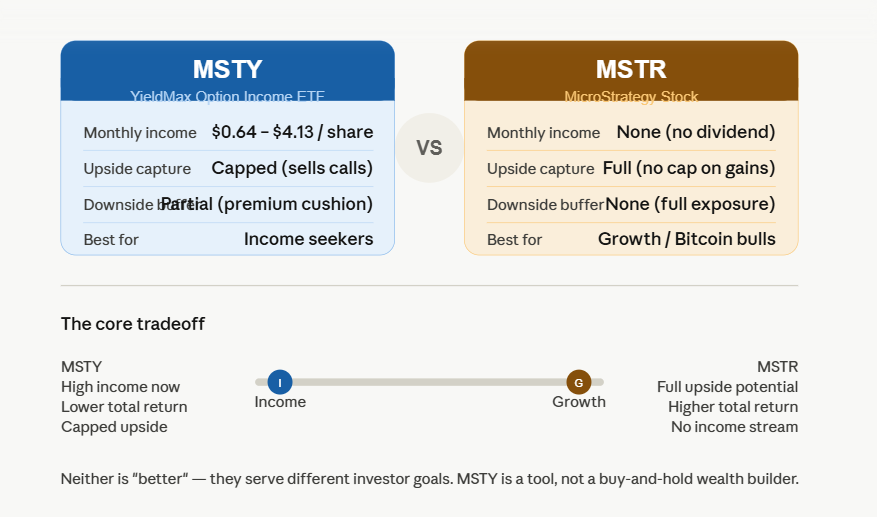
On a total return basis (price appreciation + distributions reinvested):
- Investors who bought MSTY at inception in early 2024 and reinvested distributions have fared reasonably well on paper, because cumulative distributions have been substantial.
- Investors who bought at peak NAV ($38–$40) and didn’t reinvest have likely seen negative total returns as of mid-2025, even after collecting distributions.
On a pure price appreciation basis:
- MSTR shareholders who held through Bitcoin’s 2024–2025 cycle have outperformed MSTY holders — because MSTR participates fully in upside while MSTY caps it via the call-writing strategy.
Where MSTY wins:
- Income generation — pure and simple. If you need $2,000–$3,000/month in cash flow from a $200,000–$300,000 portfolio, MSTY delivers that in a way MSTR never will.
- Lower volatility than holding MSTR directly — the option premium income provides a cushion on the way down.
Who Actually Invests in MSTY?
Based on community behavior on Reddit (r/msty, r/dividends, r/Bogleheads), YouTube, and financial forums, MSTY investors tend to fall into a few camps:
Income seekers: Retirees or semi-retired investors who want high monthly cash flow and are willing to accept NAV erosion as a tradeoff. They treat MSTY like a high-risk annuity.
Bitcoin bulls who want income: Investors bullish on Bitcoin/MSTR long-term but who want to monetize that conviction in the short term via distributions. They plan to hold for the cycle and reinvest.
DRIP compounders: Investors who automatically reinvest distributions (DRIP) to buy more MSTY shares each month, betting that the distribution income compounds faster than NAV erodes.Short-term traders: Investors who time their entry before ex-dividend dates, collect the distribution, and exit — a strategy that sounds clever but is complicated by the fact that share price typically adjusts down by roughly the distribution amount on ex-date.
Common Questions About MSTY Dividends (People Also Ask)
Is MSTY a good dividend stock? MSTY isn’t a dividend stock in the traditional sense — it’s an option income ETF. It generates income through covered call premiums, not corporate earnings or retained profits. Whether it’s “good” depends entirely on your goals. For pure income generation with high risk tolerance, it has delivered. For long-term wealth building, it’s a weaker choice than simply holding MSTR or Bitcoin.
Does MSTY pay dividends every month? Yes. MSTY has maintained monthly distributions since its February 2024 inception. The fund has not missed a monthly payment, though amounts vary significantly depending on MSTR volatility.
Why did MSTY’s dividend go down? When MSTR’s implied volatility compresses — typically during Bitcoin’s quieter periods or steady trends — the option premiums MSTY collects shrink. Lower premiums mean smaller distributions. The August 2024 payout of $0.64 was the clearest example of this dynamic.
What is MSTY’s average dividend yield? Across its full distribution history through mid-2025, MSTY’s realized annualized yield has averaged somewhere between 70–120% depending on share price at time of calculation. The wide range reflects how dramatically monthly payouts fluctuate.
Is MSTY distribution taxable? Yes. MSTY distributions are taxable and may be classified as ordinary income, short-term capital gains, or return of capital — each taxed differently. A return of capital distribution lowers your cost basis, which increases your capital gain (or reduces your capital loss) when you eventually sell shares. Consult a tax professional if MSTY represents a meaningful portion of your income.What happens to MSTY when MSTR crashes? When MSTR drops sharply, MSTY’s NAV declines in tandem (though the option premium income provides a partial buffer). If volatility spikes during the selloff, distributions may paradoxically increase — because high vol means expensive options. This is the counterintuitive nature of option income funds: their income can go up during turbulent markets, even as the share price falls.
Key Risks Every MSTY Investor Should Understand
Before allocating capital to MSTY based on its dividend history, these risks deserve clear-eyed attention:
1. Permanent capital loss risk. If you buy at a high NAV and the fund trends lower over time, distributions alone may not make you whole. This is especially true if MSTR enters a prolonged bear phase.
2. Concentration risk. MSTY’s entire income engine depends on a single company: MicroStrategy. MicroStrategy’s fortunes are essentially Bitcoin’s fortunes. You’re not diversified — you’re leveraged to one asset via one company via one ETF strategy.
3. Strategy decay. The covered call strategy is inherently designed to sacrifice upside. In a roaring MSTR bull market, MSTY will lag. The longer a bull run persists, the wider the performance gap between MSTY and a direct MSTR position.
4. Distribution variability. Unlike a bond coupon or a blue-chip dividend, MSTY distributions have no floor and no guarantee. Plan your income around the low end of the historical range, not the high.5. Expense ratio and operational costs. MSTY charges a 0.99% annual expense ratio. On top of option strategy costs (bid-ask spreads, rolling positions), the true cost of running the strategy isn’t trivial — though it’s embedded in the distribution net amounts rather than charged separately.
MSTY Dividend Reinvestment: Does DRIP Make Sense?
Dividend reinvestment (DRIP) in MSTY is a topic of genuine debate in investor communities.
The bull case for DRIP: If MSTR is in a Bitcoin bull cycle and MSTY’s NAV is stable or rising, reinvesting distributions compounds your share count at attractive prices. You’re effectively buying more income-generating shares cheaply during periods of nav dips, which improves your long-term income trajectory.
The bear case against DRIP: If the fund is in a structural NAV decline — as it was for much of 2024 — DRIP is buying more shares in a declining asset. You accumulate more units of something losing value faster than the distributions replace it. Your total portfolio value still shrinks.The pragmatic middle ground: Many MSTY investors don’t reinvest automatically. They collect the distribution as cash, assess market conditions, and decide whether to buy more MSTY, rotate into MSTR directly, or deploy elsewhere. This keeps flexibility without blind dollar-cost averaging into a declining NAV.
MSTY in the Context of the Broader YieldMax Ecosystem
MSTY is one of dozens of YieldMax option income ETFs. The fund family also includes:
- TSLY — Tesla option income
- NVDY — Nvidia option income
- AMZY — Amazon option income
- CONY — Coinbase option income
MSTY stands out within this family for a few reasons: it’s among the highest-AUM funds (assets grew dramatically through late 2024 Bitcoin excitement), it offers among the highest raw distributions, and it carries among the highest underlying single-stock volatility — all of which amplify both its income potential and its risk profile.
Should You Invest in MSTY for Its Dividend History?
Here’s the unvarnished take:
MSTY’s dividend history is real, documented, and impressive in terms of raw income generation. The fund has paid out substantial monthly distributions every single month since inception and has delivered genuine cash flow to investors who held through the full period.
But that history also shows clearly that:
- Distributions are highly volatile and not predictable.
- NAV has trended lower since inception, partially offsetting income gains.
- The strategy works best when MSTR is volatile and trending sideways-to-up — a specific market condition, not a permanent state.
If you’re a retiree who needs monthly income and can stomach Bitcoin-correlated risk, MSTY has a legitimate role in a portfolio. If you’re a growth investor or anyone whose financial goals require capital preservation, MSTY is a poor fit regardless of what the yield figure looks like on any given day.
Final Word: Reading MSTY’s Dividend History Correctly
The headline yield is a marketing number. What matters more is the trend in distributions relative to the share price you paid, the tax treatment of each monthly payout, and how the fund’s NAV has moved since your entry.
MSTY’s February 2024 peak payout of $4.13/share was extraordinary — and it was also unrepeatable under normal market conditions. The fund has since settled into a more modest but still-above-average monthly income range that reflects a more stable, if lower, option premium environment.
For investors who entered with open eyes — understanding the option mechanics, the NAV risk, and the tax complexity — MSTY has delivered on its core promise: monthly income from a volatile, crypto-linked asset. For investors who bought based purely on the headline yield, the experience has been more complicated.
Disclaimer: Use the full dividend history as context, not as a promise.
We have also compiled a useful historical data for JPST Dividend and history of Amex High Yield Savings Rate, take a look at that as well.